Market volatility has increased recently, and also the endless linear trend of the S&P 500 has been marginally affected. Quoting some numbers, the VIX index moved to over 26 in mid-October from a minimum of 10 reached this summer.
Volatility is a sign of market nervousness; besides being common during downturns (e.g. the VIX index was around 80 in late 2008, while it has been slightly above 14 on average for the last two years), it is also common to phases that are close to the end of market cycles.

Chart 1: S&P 500 (RHS) and VIX Index (LHS) in the period 2005-today (Sources: BSIC, Bloomberg)
Correlation between the benchmark and the volatility is negative, with a value of -0.58 for the last 10 years. Figures are even more negative for periods that are more recent: for instance, taking into account the dates June 2012 – November 2014, the value is -0.82.
So, is this the (beginning of the) end of the long bullish cycle for major equity markets? We tried to understand it using the put/call ratio as a sentiment indicator.
The put/call ratio, indeed, has turned out to be a useful technical indicator to gauge future market direction in the past years. It is a sentiment measure, computed as the ratio between put options volume and call options volume in a given time frame (daily, weekly, etc.).
By doing so, it is possible to “measure” the moods of market participants. On the one side, a high volume of put buyers indicates that there has been an overreaction and the market is often close to a minimum; on the other side, crowds of call buyers typically suggest a possible maximum.
That said, by combining the two volumes, we obtain the put/call ratio, which should be a reliable indicator to understand whether the market has overreacted (in any directions), hitting either a maximum or a minimum.
Such approach has worked well applied to the S&P 500 in the past, so we decided to run the analysis on that index. In particular, we looked at the CBOE Put/Call ratios.
There are different CBOE put/call ratios. In particular, we should mention the “total”, the “index” and the “equity only”. For the purposes of our analysis, the last mentioned seems to be the best: indeed, the “total” and the “index” include also hedging positions (i.e. put options on the index), which are not speculative and risk to poison the results of the study. “By definition”, the total ratio will be higher than the mere equity ratio, as shown in the following chart.

Chart 2: CBOE Total and Equity Put/Call ratios (Sources: BSIC, Bloomberg)
That said, we decided to run the analysis on daily observations of CBOE Equity Put/Call ratio (henceforth just “Put/Call ratio”).
However, as shown in the Chart 2, the ratio is really volatile; therefore, it seems better to consider also a moving average of the indicator (either simple or exponential) in order to smooth the noise.
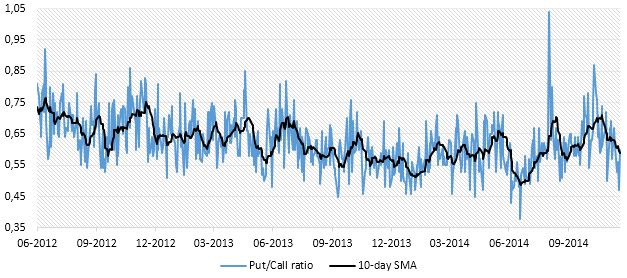
Chart 3: Put/Call ratio and its 10-day simple moving average, SMA (Sources: BSIC, Bloomberg)
By using a simple moving average, we already managed to reduce a lot of short-term noise.
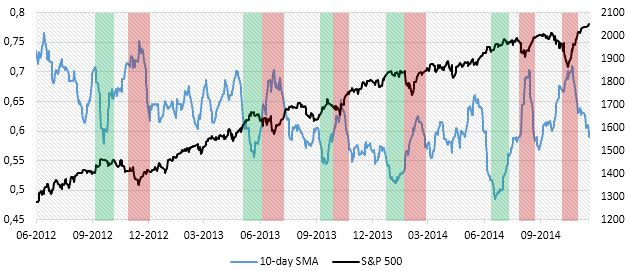
Chart 4: Put/Call ratio 10-day SMA and S&P 500, June 2012-today (Sources: BSIC, Bloomberg)
The results seem to be satisfactory, with a clear negative relation between the index and our indicator. The graphical evidence is also sustained by statistics, with a negative correlation (-0.44).
Nevertheless, there is a relevant issue to solve: how do we know whether the ratio has reached an extreme or not? As a matter of fact, there are not absolute values, but levels change over time. For example, 0.75 has been an important reversal point in December 2012; in the following periods, however, lower levels have played the same role.
There are two possible solutions to this: we can either use static or dynamic limits.
Static bounds may be drawn taking recent extremes as thresholds: this is a simple but effective approach, which leads to an easy interpretation of results. More consistently with a mathematical approach, however, it would be better to use standard deviations from the mean or the median, as showed in the following chart.

Chart 5: Put/Call ratio 10-day SMA and static limits (Sources: BSIC, Bloomberg)
The ratio is currently crossing the static mean at 0.59: this level did not provide any floor to rebounds of the indicator in the last 18 months, so we may state that we expect the Put/Call ratio to fall at least towards the line -1SD before reverting the path. Consistently with what we said before, this would imply that the S&P 500 has not reached a maximum yet.
A more complex method would be to consider current market volatility or the ratio volatility in order to set time-changing limits to the floating range. We applied the latter option.
A practical example may be to use the same approach of Bollinger Bands, which are computed as standard deviations from the 20-period moving average. In the following chart, we used an exponential moving average. Then, we computed the upper and lower bands as 0.5 standard deviations from that average; on the downside, we plotted also the line representing 1 standard deviation from the mean, since it has showed to be reliable in previous periods.

Chart 6: Put/Call ratio 10-day SMA and dynamic limits (Sources: BSIC, Bloomberg)
The analysis seems to be very effective in providing signals to “trade” the ratio:
– The upper +0.5SD band has always resulted to be a turning point for major movements of the ratio.
– The lower -0.5SD band has done well in most cases.
– When the -0.5SD was crossed down, the -1SD band has acted as a strong dynamic support.
That said, and taking into account the results from the static analysis, it seems that it would be better to wait for the ratio to reach the lowest band of the chart. Furthermore, considering that our initial aim was to provide some gut feeling of the closeness of bullish market end, it is even more probable that there will be an extreme movement.
Therefore, we believe that it is still too early to call for a bear market in the US. However, volatility has increased (and it is likely to grow even more): the Put/Call ratio appears to work well on the medium-term, being able to identify overreactions on the markets, but the noise is too strong to extrapolate information for the very short-term. Thus, short-term market corrections may occur without changing the medium-term view provided by this sentiment indicator.
In conclusion, it is also relevant to stress that one single indicator may lead to imprecise signals: so, it is essential to look also at other figures to frame the big picture of the situation and confirm the results of this analysis.
[edmc id=2161]Download as PDF[/edmc]


0 Comments