Introduction
Trade wars and tit-for-tat tariff threats between the two largest national economies should not be expected in a world embracing trade integration and common regulation through institutions such as the World Trade Organisation (WTO). However, this is exactly what we are currently observing in a US-led, politically motivated upheaval against Chinese trade practices, that are deemed “unfair”. Various other developments, such as the Brexit vote in the UK, can be likewise considered as manifestations of a turn away from general openness and towards more nationally focused interests. In this article, we will analyse global trade relationships, specifically involving the US economy, in greater detail, to evaluate the possible consequences of tariffs and trade wars.
Where We Are Now
To understand how the United States were able to become the globally dominant economic superpower, we require a certain historical background knowledge. The success of the US can be attributed to a combination of luck and skill. With the imposition of the Bretton Woods system, the country managed to make its own currency the preferred payment option for all international transactions across the globe. As a consequence, the US dollar is now considered the world’s reserve currency. This gave rise to several positive and negative repercussions. One of these is an increased demand for US dollar reserves by foreign governments and central banks, which leads the dollar to appreciate. This decreases the competitiveness of US exports and lowers the costs of imports. In the long run, ceteris paribus the current account deficit of the US will therefore increase.
Of course, there can be other reasons for an excessive increase in the US current account deficit. Among such reasons are unfair trade practices by trading partners, who subsidise their exports, distort their exchange rate to undervalued levels or protect their domestic industries from foreign competition. The argument that the US is suffering from unfair global trade practices, which manifests itself in large current account deficits, is at the core of Donald Trump’s successful election as President of the United States. Most of all, he blames China for the US’ suffering and has taken steps to remedy this unfairness.
However, we believe there is more to the US current account deficit than just unfair trade practices and that the current trade imbalance evolved gradually over time. Particularly notable are the 2000 and 2008 market busts and the 1990s Latin America and Russia crises, all of which led to massive capital flight to the US. In times of uncertainty investors considered, and still do now, the US Treasury debt always as the safest form of investment.
During the recent 2008-2009 recession, GDP contracted and thus also global trade. The US, by being a net importer could not upstand its situation and had to reduce import consumption, leading to an improvement of the current account by 100%. Still, the account remains negative. (It can be seen in the graph below).
The underlying, downward pressures apparently remain significant. Such factors are most of all the high savings rate in China, low savings rate in the US, and increasing budget deficits run by the US government (exacerbated by recently approved higher spending and lower taxation).
According to this macroeconomic equation, the higher government deficits and low savings rate in the US add up to a worsening in the current account. This is key to understanding that massive capital inflows are required to offset the negative domestic forces.
CA + I = Sp + Sg
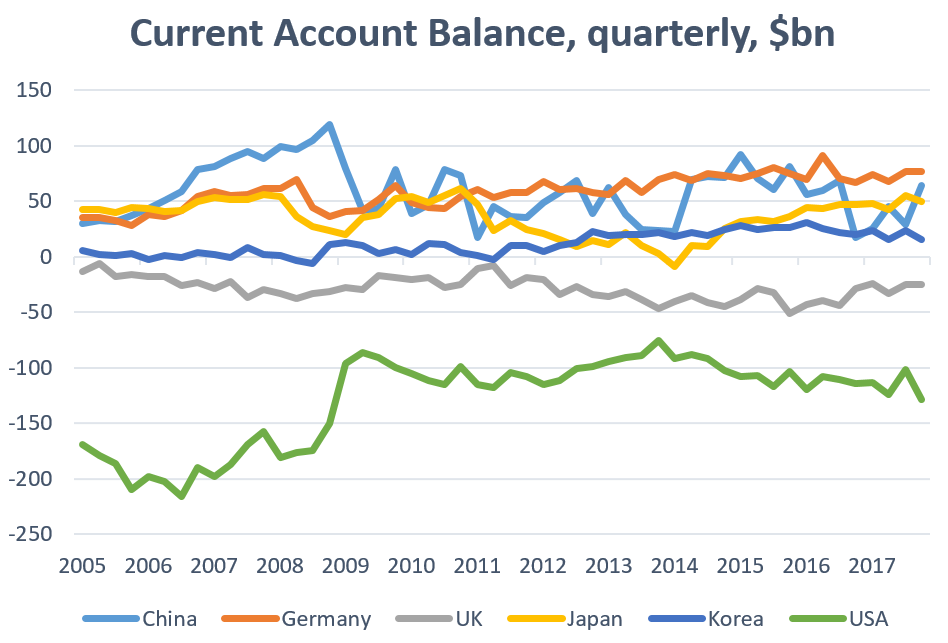
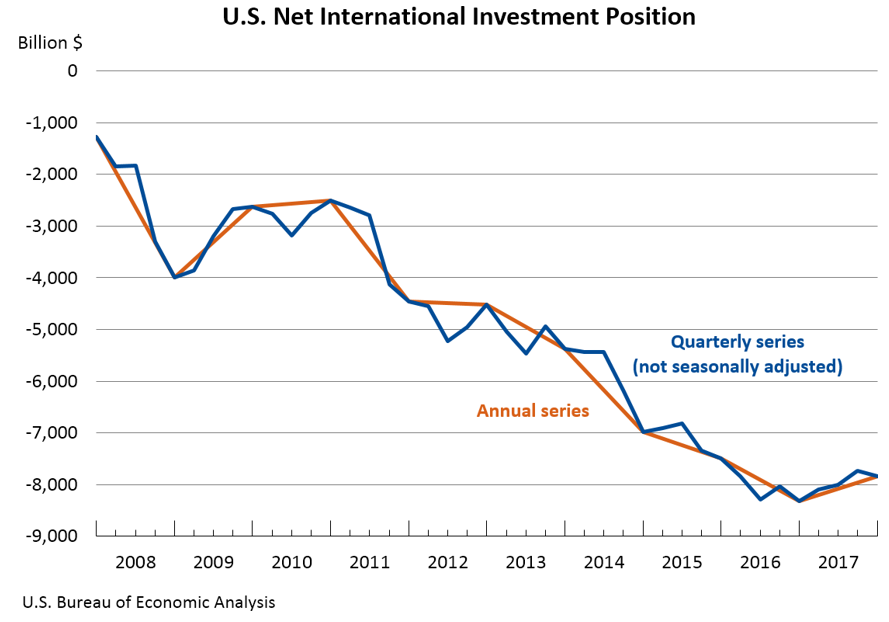
In order to finance their consumption, which is larger than what the economy produces, US consumers have recourse to foreign borrowing. The foreigners now not only purchase US debt obligations, but also increase their foreign direct investments (FDI) buying US equities, real estate and other kinds of property. As the graph below depicts, both quarterly and annual statistics indicate that since the 2008 financial crisis, the net investment position of the US has been rapidly declining. Initially at about -$1 trillion, it plummeted all the way to -$8 trillion at the end of 2016. Adding the net financial claims of the US on the rest of the world (negative value), back to the US net wealth, yields approximately $98 trillion. As a result, we can derive the share of foreign ownership of the US, which equals 8.2%. Back in 2003, Warren Buffet estimated this value at 5%, so obviously the internationally owned share is growing. This means that an increasing number of foreigners do not simply want to hold US debt, but are seeking to invest in the real economy. What is more, even if foreigners would like to sell their holdings of US assets, they cannot easily rid themselves of their positions as wholes, because the best they can do is to sell to other foreigners. At the bottom line, foreigners will still own a share of US assets. The only method to reduce the trade deficit, would be to run current account surpluses, hence buying foreign assets and decreasing the exposure of foreigners to domestic assets.As can be seen from chart above, the current global trade environment suggests that there are two opposing fronts. Net exporters, the group of countries composed by China, Germany and Japan, who have been running current account surpluses for most of the past decade, and net importers, such as the US and the UK, who recorded steady trade deficits.
US – Chinese Trade Relationship
The trade relationship between the US and China was re-established alongside diplomatic ties in 1979. An initial bilateral trade agreement, a mutual most-favoured nation obligation and later access to the WTO, GATT etc. led to a massive expansion in bilateral trade. What started off in 1980 with a total bilateral trade volume of $4 billion, has grown to a $636 billion in 2017. Today, China is the largest trading partner of the US. The countries exchange goods, services and capital, but with varying implications for their balances of payments.
The US has been deriving a trade deficit from its trade in goods with China since 1990. The deficit increased from $10 billion in 1990 to $375 billion in 2017, making it the largest US trade deficit in goods with any partner by far.
From the US perspective, China is its 3rd largest export market for goods and 2nd largest export market for agricultural goods. Since 2000 the share of total US exports going to China increased from 2.1% to 8.4%. In absolute values this equates to a 491% growth in total export value to China. The top five products exported to China are:
- Aerospace components
- Oil seed and grains (soybeans major proportion)
- Motor vehicles
- Semiconductors and electronic components
- Waste and scrap
As an indication for the relevance of the Chinese market for US industries, one may note, that China is Boeing’s largest client outside the US and General Motors (GM) sold more cars in China between 2010 and 2017 than in the US.
Considering goods’ imports, China is the largest source of US merchandise imports. Its share in US imports rose from 8.2% in 2010 to 21.6% in 2017. The top five import goods from China
- Communication equipment
- Computer equipment
- Miscellaneous manufactured commodities
- Apparel
- Semiconductors and electronic components
The circumstances in trade in services are similar in their magnitude but opposite in their effect on the balance of payments. From US perspective, China is 3rd largest export market, but only 11th largest import market. In 2016, the US derived a $37.3 billion trade surplus from its trade in services with China, which is the largest trade surplus in services with any partner. Nevertheless, this surplus helps little in negating the $375 billion deficit from the trade in goods between the US and China.
Many spectators have asked how China could maintain such a large trading surplus, not only with the US but on its overall balance of payments. Usually, developing countries run a current account deficit and a capital account surplus to benefit from the foreign supply of capital. China on the contrary has accumulated annual trade surpluses ever since 1992. The causes of its trade surplus, its magnitude and longevity can be manifold.
The Chinese population has been saving more than it is investing for a long time. Hence, an expanding production during periods of stagnant consumption implies that most products had to be exported. This was facilitated by the Chinese governments’ intervention in the foreign exchange reserve markets, which artificially pegged the Renminbi to the US-Dollar at a very low exchange rate. Therefore, Chinese exports, in addition to being cheap due to lower labour costs within China, are more competitive internationally thanks to low exchange rates. Other possible explanations using national characteristics to explain China’s international success include distortionary government policies in factor markets and China’s demographic advantage due to a large labour force. An explanation focusing on regional dynamics ascribes China’s export dominance to the reallocation of most businesses and investments in the manufacturing industry from throughout South-East Asia to China. This is corroborated by statistics showing that out of the total US imports, the overall share of Pacific Rim ones remained stable since 1990, while Chinese share expanded. Hence, the large trade deficit with China would not be due to unfair trade practices but due to regional sectoral shifts and reallocations.
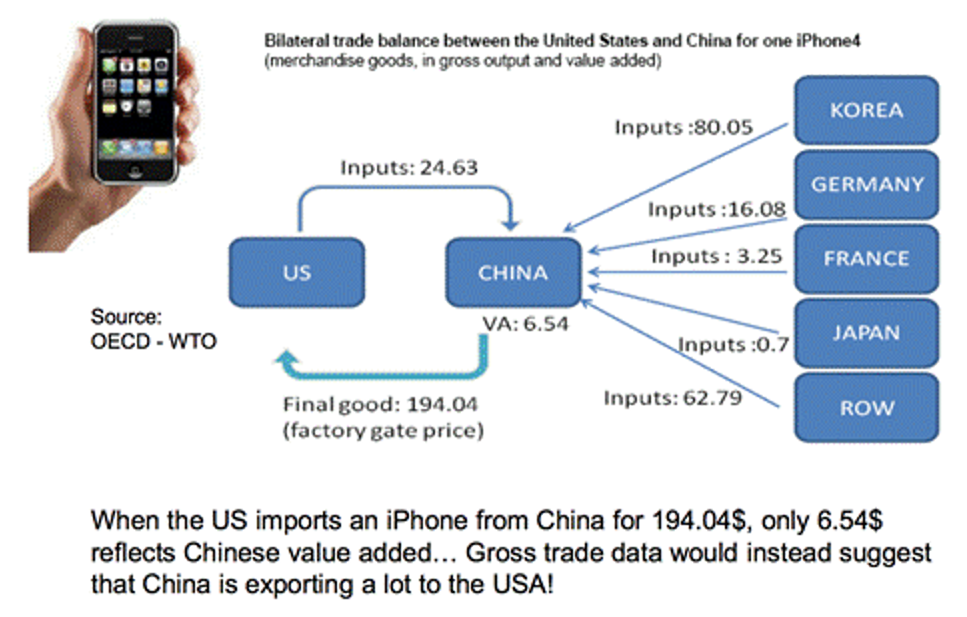
In the light of these explanations, some criticism of China’s trade practices as frequently repeated by POTUS Donald Trump seems warranted, while some of it is not. Moreover, the trade in goods between China and the US has to be evaluated taking into account that many exports from China to the US derive most of their gross value from previously imported components to China. Several studies found that up to 40% of the components of Chinese manufactured goods are of foreign origin. Hence, much of what the US imports from China is based on the US’ own exports to China. Subtracting the value of these inputs and considering only the value of production occurring in China, the US trade deficit in goods and services with China in 2011 declines by 35%. At a mere $181 billion that year, it is comparable with the US’ trade deficit with the European Union. To consider only the value added in China for trade deficit evaluations is increasingly important due to the high relevance of global value chains (GVC).
The GVC concept refers to different product components being produced all over the world, assembled in one place and then exported to other countries to be sold to the end user. As it happens, China is the cheapest place to assemble different product components in many industries, hence most exports of end user products come from China. However, the domestic value added in China usually only accounts for a very small proportion of the overall products’ worth.
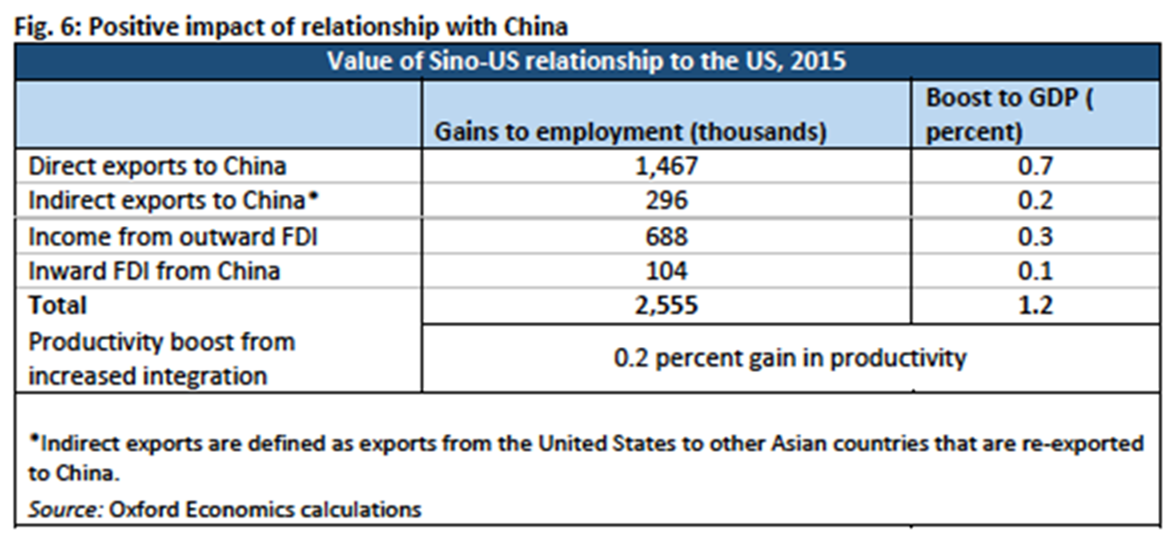
It is also important to consider the beneficial effects for the US derives from trade with China. When manufacturing industries shift to China for cost efficiency reasons, some jobs in the US are of course lost. However, the US consumers gain equivalently as the prices of their consummated goods are minimised. In addition, the volume of goods and services produced in the US and exported to China remains considerable. A study by Oxford Economics finds that in 2015, the exports of goods and services to China, in addition to bilateral FDI supported 2.6 million jobs in the US and contributed about $216 billion to the US gross domestic product (GDP). This was equivalent to a 1.2% share of the GDP of the US.
The Trade Dispute
Given these underlying trade dynamics, current movements towards a bilateral trade war could have significant negative implications for the US as well as for China. US president Donald Trump repeatedly promised during his election campaign, that he would stop China’s unfair trade practices, bring back jobs to the US and reduce the country’s overall trade deficit significantly. His biggest move to reach this goal so far, was the imposition of tariffs on steel (25% ad valorem) and aluminium (10% ad valorem) imports, which went into effect on March 28th. Currently, seven large economies, namely Canada, Mexico, the EU, Australia, South Korea, Brazil and Argentina are exempted from these tariffs, but their exception expires on May 1st. China responded in kind, by levying equivalent 15-25% ad valorem tariffs on 128 imported goods in the agricultural and industrial product sectors on April 2nd. These imports are jointly valued at about $3 billion, analogous to the imports subject to US tariffs.
Both countries have brought a case against the other before the WTO dispute settlement body this month, citing unfair trade practices not in line with WTO obligations as cause of concern. In the days following April 2nd, the US proposed 25% tariffs on further imports in the industrial product, transport and energy sectors, worth roughly $50 billion and China promptly responded by proposing similar tariffs on US imports worth an equivalent amount. Their tariffs will become effective only when the US imposes its proposed tariffs. One day later, Trump retaliated by announcing that he had his specialists test whether a tariff on imports worth another $100 billion were warranted and could be imposed. So far, no public disclosure of the findings of such a test has been made. Instead, China imposed a 178.6% tariff on sorghum imports from the US, worth $1 billion on April 17th, while coincidentally announcing that it will lift the restrictions on foreign company ownership by 2018 and in the automotive sector by 2022. Although a remarkable concession and a clear response to US complaints about ownership restrictions, the US did not accept these concessions as significant remedy and reason to enter into negotiations
| Country | Goods | Tariff | Worth |
| US April 2017 |
tariffs on Canadian softwood lumber, heavily used in construction and furniture goods | 20% | |
| US (PROPOSED)
Oct 2017 |
tariffs on Canadian Bombardier jets | 300% | |
| US
Jan 22 |
photovoltaic cells
washing machines |
30 > 15%
20 / 50% |
|
| US
March 28 |
steel, aluminium
(industrial products & technology) |
25%
10% |
$3 bn |
| China
April 2 |
fruits, nuts, steel pipes/equipment for oil industry
(agricultural, industrial products & technology) |
15-25% | #128
$3 bn |
| US (PROPOSED)
April 3 |
(industrial products & technology, transport, energy)
colour TV, printing devices, displays, storage units, connectors, transceivers, electric motors motor vehicles for person transport, motorcycles, vessels, helicopters railway/airplane/turbojet parts hydraulic turbines, nuclear reactors, gas turbines, offshore drilling platforms |
25% | #1333
$46 bn |
| China (PROPOSED)
April 4 |
(transport, agriculture, energy, industrial products & technology)
aircraft, off-road vehicles, other vehicles soybeans, cotton, tobacco, beef, wheat, corn, whiskey liquid propane chemical reagents, catalysts, lubricants, plastic, polymers |
25% | $50 bn |
| US (TESTING)
April 5 |
any | $100 bn | |
| China
April 17 |
sorghum | 178,6% | $1 bn |
| US
April 2018 |
enhanced sanctions towards Russia, including billionaire owner of Rusal, Oleg Deripaska, affects aluminium |
Economics of trade protectionism
So why are tariffs being imposed? The first argument is to increase the number of jobs in the protected industries by permitting a higher price due to lower international competition and thus higher profitability. Secondly, tariff revenues also benefit the government. However, the higher price in a strategic industry, such as steel and aluminium, transforms into higher prices of final goods such as packaging materials, cars, electrical appliances. Hence, the amount people can buy with their disposable income is reduced, making the population on aggregate poorer.
The US has made some experiences with prior enactments of tariffs. In 2000, when President Bush introduced tariffs between 8% and 30% on imported steel goods, Mackinac Center for Public Policy estimated that the GDP shrunk by up to $1.4 billion, with a cost of $400,000 for every steel job saved. In addition, 8 jobs in other sectors would be lost for each single one saved in the steel-producing sector. Even before that, in 1994 alone, the introduced tariffs cost the US $32.3 billion and round $170,000 for every job saved, the National Center for Policy Analysis estimates. Tariffs in Europe during the same year cost $70,000 per job saved, while in Japan consumers lost $600,000 for every job saved. But it is generally hard to connect the gains in one industry with losses in another. We cannot tell how many farmers will lose their jobs as a result of tariffs on softwood lumber, for instance, but it is easy to establish how many jobs are saved in the softwood lumber industry in the US when Canadian lumber imports are cut off.
Under certain circumstances tariffs may be justified. For example, in a recently established infant industry. Let us assume there are only two countries that produce a good, with country Home gaining a head start. At point 1 it produces a quantity A of the good at price TH, later as it benefits from economies of scale, it is able to improve the average cost to the one we have at point 2. However, having a look at country Partner’s average cost curve, we can see that it is located lower than that of Home at point 1, which means that Partner is more efficient. However, Partner is stuck at point 1 with price Tp which is higher than price 2 of Home. Because of this, Partner is not able to compete, however if it were to increase the demand for its good sufficiently by using tariffs and subsidies, the average cost could drop below that of Home, making Partner’s goods internationally competitive.
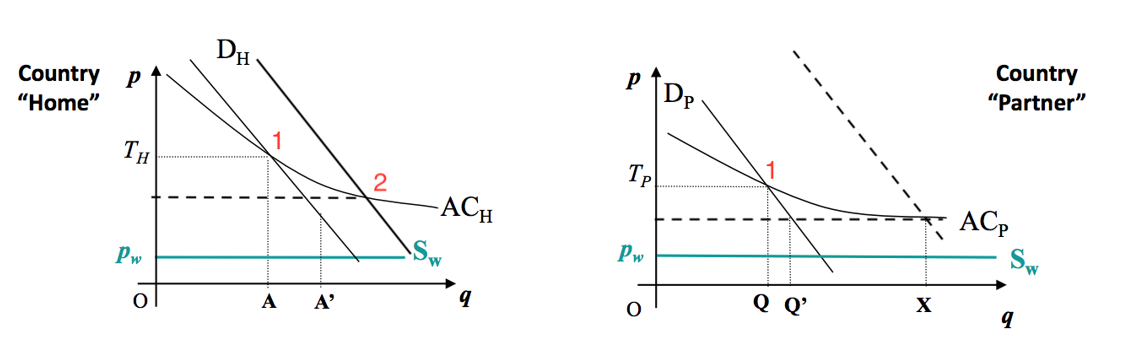
In our real world, Home is any foreign importer, while Partner is the US. By protecting its domestic infant industry with tariffs, the US can make the industry viable. However, the US is a mature economy which is not protecting infant industries, particularly not with tariffs in the steel sector, which is a mature and declining one. According to the Council on Foreign Affairs, about 140,000 people work in the steel sector of the US today, which is significantly lower than the figure of 650,000 back in the 1950s. This corroborates the fact that the steel industry is a mature and declining branch, which is being replaced by more innovative and technologically advanced industries, which create new employment opportunities. As Stephen Poloz, Bank of Canada Governor put it: “The investments made today in existing and new companies will exploit technological breakthroughs and create tomorrow’s jobs in new and existing sectors, even as they disrupt some established industries, he said. Many new jobs are created in sectors where the required skills are not very different from those being disrupted. Throughout history, technological advances have always led to rising productivity and living standards, and they have always created more jobs than they destroyed.”
Consequences of US-Chinese Tariffs
Some countries that have a lot to lose from the initiated trade tariffs are those that have a high degree of exposure to global trade, not necessarily to the US alone. Once a trade war with tit-for-tat tariffs between various actors is initiated the global value chains mentioned before would be destroyed. Highly open countries, dependent on their role in the global value chains are likely to suffer significantly. The table below depicts the largest sources of US imports, juxta-positioned against the degree of openness of these same economies. In spite of the obvious losers Canada and Mexico, who will undoubtedly lose should the NAFTA deal be abolished, countries such as Ireland, Vietnam and Malaysia which are highly reliant on global trade, are also prone to be adversely affected. Certain European countries, such as Germany, France, Italy and the UK, may be affected through the same channel.
| Country | USD, billion | Country | Openness (E/GDP), % |
| China | 84.9 | Ireland | 125.5 |
| Mexico | 52.2 | Vietnam | 93.6 |
| Canada | 50.2 | Malaysia | 67.6 |
| Japan | 22.1 | Germany | 46.1 |
| Germany | 19.8 | Korea, South | 42.2 |
| Korea, South | 10.6 | Mexico | 38.2 |
| United Kingdom | 9.5 | Canada | 30.1 |
| Ireland | 9.0 | Italy | 29.8 |
| India | 8.4 | France | 29.3 |
| Italy | 8.3 | United Kingdom | 28.25 |
| Vietnam | 7.5 | … | … |
| France | 7.4 | China | 19.6 |
| Taiwan | 7.0 | India | 19.2 |
| Malaysia | 6.1 | … | … |
In addition, we can identify certain export and import industries that will be affected or are already affected by the tariffs. Exporters of steel and Aluminium, such as Germany, South Korea and Brazil, are exempt from the US tariffs only until May 1st. From then on, and some are already feeling it now, their prices and revenues in the US will be squeezed and they will have to find substitute markets to sell their products. However, demand is limited and margins may be sufficiently compressed to justify shifting the steel production from highly developed countries, such as Germany entirely. Steel importers, on the other hand, will benefit as export countries will compete to sell their steel elsewhere and will therefore lower their prices.
A similar chain of winners and losers may be observed in the trade for agricultural produce. China is the world’s largest agricultural importer but prices on US goods will rise heavily as a consequence to recent tariff proposals or impositions. US farmers will have to find other export destinations and may see their margins wane as they are competing for these markets with large quantities of produce no more shipped to China. Substitute exporters of agricultural products, such as Brazil and Argentina for soybeans will instead see their prices increase significantly, as China will have to source its food imports elsewhere.
Another group of economies that is likely to be adversely affected by a trade war between the US and China is composed of smaller Asian export economies. Taiwan, Vietnam and Malaysia are primary suppliers of intermediate inputs for electronic products and machinery, which China imports, assembles and then exports to a large part to the US. These products are the main focus of Trump’s proposed tariffs from April 2nd. Via the global value chains, not only Chinese assemblers but also the producers of China’s imports will be hurt significantly by these tariffs.
In general, high tariffs on various intermediate and consumption goods will increase overall prices for all targeted product sectors. Increasing prices will put upward pressure on inflation and may lead to interest rates raises. This will increase the relative attractiveness of fixed income instruments with respect to equities and reduce the portfolio of profitable investment opportunities for companies. The gradual economic recovery, which we have been experiencing since 2010 is likely to come under additional strains from such developments.
Summary
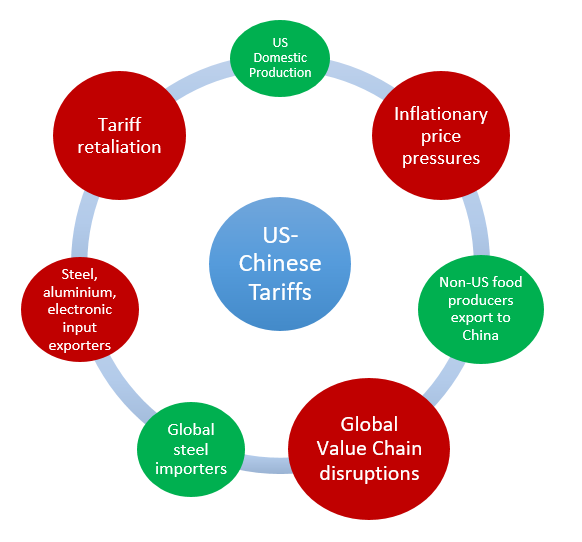
The graphic below depicts a summary of the most likely outcomes following the imposition of far-reaching import tariffs. The possible positive outcomes include a rise in US domestic production, leading to wage and employment increases, as well as economies of scale and lower costs in some sectors. However, these benefits are highly limited as they pertain only to the US, and only to a small share of its domestic industries. Additionally, several non-US exporters of food and agricultural goods may benefit as they may substitute Chinese imports from the US.
The negative consequences, on the other hand, will be much more widely felt. Consumer prices in the US and China, are likely to rise and a disruption of global value chains will also increase prices elsewhere. Global exporters of steel, aluminium and any other good or intermediate input for goods taxed by the US will see their prices and profits squeezed. Substituting the large export market US with another will be extremely difficult.
In the long-term inflationary pressures on prices will reduce the purchasing power of consumers and may lead to interest rate hikes, that will not only affect the US but many industries around the world. The progress we have made since the financial crisis in 2008 will unambiguously halt and may even be undone by a full-fledged, global trade war.


0 Comments