Given the recent market volatility, and the prolonged commodity rout, we decided to investigate whether some long-term relationships are still present on the market. And, of course, we looked for potential trades arising from the situation. We analysed different commodities on different time-frames (from 5-minute to weekly data). While noise seems too strong and liquidity is not always satisfactory on the very short-term, we found some interesting relationships on daily data. Nonetheless, we keep monitoring intraday price movements in order to find short-term, low risk returns. Among the different analyses, we decided to concentrate just on the following one: cointegration between corn and wheat.
We do not want to focus on the fundamental differences between the two types of grains actually; still, it seems useful to know that Corn is the most widely produced feed grain in the United States, accounting for more than 90% of total production. Around 80 million acres of land are planted with corn. The majority of the crop is used as livestock feed; the remainder is processed into a multitude of food and industrial products including starch, corn oil, and ethanol for use as a fuel. On the other hand, Wheat is mainly used in food products such as pasta, bread and baked sweets in Western countries and noodles in Eastern countries. Due to its higher nutritional properties, wheat has historically traded at a premium to corn except for a few periods. The premium displays a seasonal behaviour and it tends to peak during the US corn harvest period, which is between July and August. The premium tends to fade in the following months due to a post-harvest rise in corn prices and a decline in wheat prices driven by the southern hemisphere harvest.
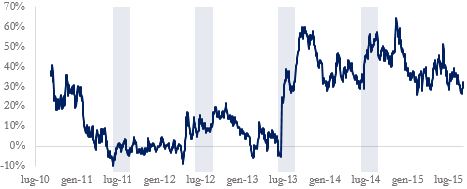
Chart 1: Wheat – Corn premium (source: BSIC, Bloomberg)
Moving to the statistical side, we analysed daily data from September 2010 to September 2015. The descriptive statistics showed us a pretty bad, but rather similar, mean/variance profile for both corn and wheat contracts.
Therefore, we decided to focus on pairwise relationships to possibly exploit.
We estimated correlation with a Dynamic Conditional Correlation model. Firstly, we estimated volatilities of each asset through a N(A)GARCH model, which is a non-linear asymmetric model that takes into account the so called leverage effect (negative shocks in returns imply a higher next-period variance). Secondly, we used this estimates to find standardized returns, namely zi,t = Ri,t / σi,t for all i, and we computed the conditional covariances of standardized returns (indeed, it can be demonstrated that the conditional covariances of standardized returns are equal to conditional correlations of raw returns). As the chart below shows, we obtained a dynamic correlation time series that is stationary. In particular, its long run mean is 0.6085. Therefore, correlation should decline in the next period.
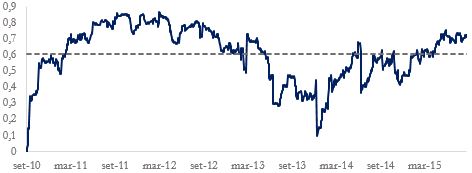
Chart 2: Wheat – Corn dynamic conditional correlation (source: BSIC, Bloomberg)
After that, we tried to test whether the two series were cointegrated. Let us first briefly explain what cointegration is in simple words. Basically, two non-stationary time series are cointegrated if there exists a linear combination of them that is stationary. This means that we can build a portfolio that is mean reverting to its long-run unconditional mean. We found out that corn and wheat are cointegrated, but a “break” in the cointegration relationship occurred in July 2013. In fact, the future price experienced a sharp decline due to the rollover of the contract. On the one hand, July contract reflected tight supplies resulting from a drought the previous year; on the hand, September prices were sharply lower because good weather paved the way for an exceptional harvest in July/August, meaning new supplies would have been available at the time the September contract would expire. Since that break, the price has evolved more steadily, and we believe that it will continue to do so in the next months. The cointegrating vector is (1,-0.5967) and the long run mean is 0.6737. This means that the series cornt-0.5967wheatt-0.6737 should converge to zero.
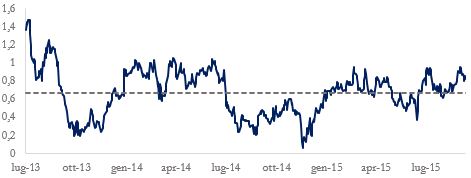
Chart 3: Cointegration (source: BSIC, Bloomberg)
As we can see from the chart, the series is currently above its long-run mean; therefore, we should buy 0.5967 wheat contracts for every sold corn contract and hold this position until it converges to the mean.
[edmc id= 2915]Download as PDF[/edmc]


0 Comments